Most board presentations on cybersecurity end the same way. The CISO walks through a heat map of red, amber, and green squares, mentions a few threat actors, and asks for budget. The directors nod, ask whether “we’re covered,” and approve a number that has more to do with last year’s spend than this year’s risk.
The problem isn’t that boards don’t care about cyber risk. It’s that they’re being asked to make a financial decision with no financial information. A board approves capital for a new plant by comparing cost to return. It approves insurance by weighing premium against exposure. Cybersecurity is the one major risk category where many organizations still ask leadership to decide based on color coding.
That gap is getting expensive. According to IBM’s 2026 Cost of a Data Breach Report, the average breach in Canada now costs CA$7.11 million, the highest figure since the study began. When the number on the table is that large, “high, medium, low” stops being a useful answer.
This guide gives CISOs and IT leaders a practical way to translate cyber exposure into the language boards already use: dollars, probability, and return on investment, so security decisions can be prioritized, funded, and measured.
CyberClan perspective: quantify the exposure, validate the assumptions, strengthen the controls, and measure the residual risk.
Key takeaways
- Boards make better security decisions when risk is expressed in dollars, not heat maps or threat counts.
- Most cyber loss falls into three buckets: downtime, recovery spend, and regulatory and legal exposure. Each can be estimated with data you already have.
- Annualized loss expectancy (ALE) turns a scary scenario into a yearly number you can compare against the cost of controls.
- Ranges beat single numbers. A low, likely, and high estimate is more credible than false precision.
- The goal isn’t a perfect model. It’s a defensible one that lets leadership compare options.
What Is Cyber Risk Quantification?
Cyber risk quantification is the practice of estimating, in financial terms, how much a cyber incident is likely to cost an organization and how often it is likely to happen. It replaces qualitative ratings like “high” or “medium” with dollar ranges, so leadership can compare security investments the same way it compares any other business spend.
Frameworks like FAIR (Factor Analysis of Information Risk) formalize this, and large enterprises often run it through dedicated software. But mid-market organizations do not need a dedicated platform to get started. They need three things: a realistic incident scenario, a defensible estimate of financial impact, and an evidence-based view of likelihood.
Why Heat Maps Fail in the Boardroom
Heat maps aren’t useless. They’re a fine way for a security team to triage its own work. They break down when they’re used to drive investment decisions, for a few reasons.
They can’t be compared. Is one “high” ransomware risk worse than three “medium” vendor risks? A heat map can’t say. A dollar figure can.
They hide the size of the problem. “High” for a $20 million company and “high” for a $2 billion company are very different exposures, but they look identical on the slide.
They don’t show what the money buys. If a board approves $300,000 for managed detection and response, a heat map can show a square moving from red to amber. It can’t show that the organization’s expected annual loss dropped by $800,000. That second number makes the business case visible and gives leadership a measurable basis for funding decisions.
The Three Cost Buckets Every Board Understands
Cyber incidents create costs well beyond any ransom payment. For board-level planning, most financial impact can be organized into three practical buckets. Building the model around them makes the conversation with finance clearer and more decision-ready.
1. Downtime: What It Costs When the Business Stops
Downtime is usually the largest cost, and the one organizations most often underestimate. Industry surveys commonly put average ransomware disruption at around three weeks, and that average is skewed by organizations that had no tested way to restore.
A workable formula:
Downtime cost = (Annual Revenue / 365) x Revenue dependency x Days disrupted + Idle labor + Contract penalties
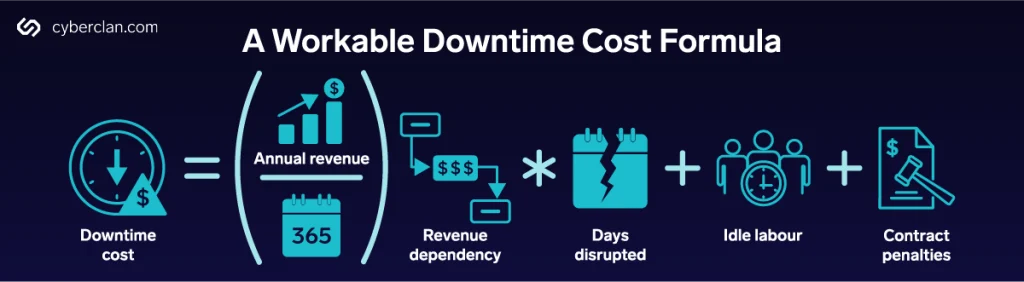
- Revenue dependency is the share of revenue that actually stops when systems go down. A manufacturer whose production lines run on the affected network might be at 80%. A professional services firm that can keep billing on laptops might be at 30%.
- Idle labor is payroll for people who can’t work, plus overtime for the people rebuilding.
- Contract penalties cover missed SLAs, delivery delays, and chargebacks. Ask your sales and legal teams. They can identify the agreements where disruption creates the greatest financial exposure.
Your finance team already has the inputs. Your business continuity plan should have recovery time estimates. If those estimates are missing or have never been tested, treat that as an immediate resilience gap to validate.
2. Recovery Spend: What It Costs to Get Back
Recovery spend is everything you pay to contain the incident, investigate it, and restore operations. It typically includes:
- Incident response and digital forensics
- Breach counsel and outside legal advice
- Rebuilding or replacing systems, plus emergency hardware and licensing
- Data restoration and validation
- Notification, call center, and credit monitoring for affected individuals
- Crisis communications and PR support
External benchmarks help frame the potential scale of recovery costs. Sophos’s State of Ransomware 2026 survey puts average recovery cost, excluding any ransom payment, at US$1.7 million. IBM also found that supply-chain compromise is now the single biggest driver of higher breach costs in Canada, adding roughly $CA368,000 per incident.
This is also where preparation can create visible operational and financial value. Organizations with an incident response retainer in place skip the hours spent finding, vetting, and onboarding a forensics team while an attacker still has access. We covered why that matters to insurers in What Underwriters Actually Want to See in Your IR Plan.
3. Regulatory and Legal Exposure: What It Costs When Someone Holds You Accountable
This bucket is the hardest to estimate and the easiest for boards to grasp, because directors increasingly understand that regulators can now levy penalties tied to revenue.
In Canada, Quebec’s Law 25 is the clearest example. The Commission d’accès à l’information can impose administrative penalties of up to CA$ 10 million or 2% of worldwide turnover, whichever is greater, and penal fines can reach CA$25 million or 4% of worldwide turnover, according to Osler. Federally, PIPEDA’s fines are far smaller, up to CA$100,000 per violation, but the legal costs, investigation response, and potential class actions around a breach can dwarf the fine itself.
Organizations operating in the U.S., U.K., or EU face their own regimes, including state breach laws, sector rules, and GDPR. For the board, the useful number is not simply the maximum penalty. It is a realistic exposure range, developed with legal counsel based on the data you hold, the jurisdictions in which you operate, and where affected individuals are located.
Don’t forget the contractual side. Many customer and partner agreements now include security obligations and indemnities. A breach that exposes a major customer’s data can trigger costs that never touch a regulator.
How to Turn a Cyber Scenario into an Annual Dollar Figure
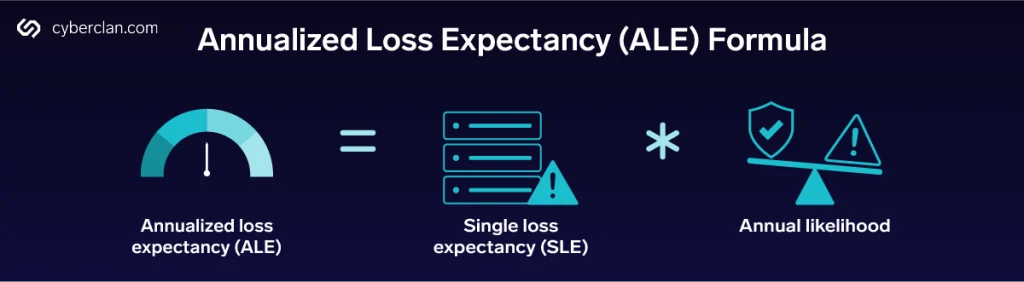
Once you can estimate what a single incident costs, the next step is to factor in how often it’s likely to happen. That gives you annualized loss expectancy (ALE), the number boards can compare directly against what controls cost.
ALE = Single loss expectancy (SLE) x Annual likelihood
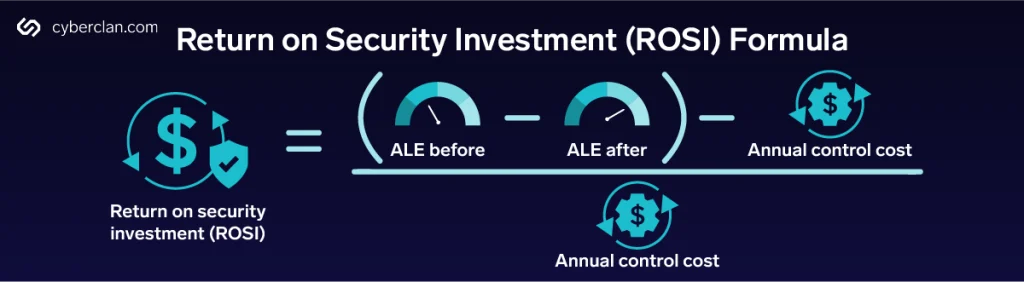
Then evaluate a security investment by comparing the expected loss reduction with the annual cost of the control. This is often expressed as return on security investment (ROSI):
ROSI = ((ALE before – ALE after) – Annual control cost) / Annual control cost
A Worked Example: A Mid-Market Manufacturer
Consider a Canadian manufacturer with CA$150 million in annual revenue. The scenario is a ransomware attack that encrypts production and ERP systems. The figures below are illustrative assumptions to show the method, not benchmarks.
Today, the company has untested backups on the same network as production, EDR with no after-hours monitoring, and an incident response plan nobody has exercised. A realistic estimate is 14 days of disruption at 60% revenue dependency.
With an investment of CA$250,000 a year in 24/7 managed detection and response, isolated and tested backups, and an IR retainer with an annual tabletop exercise, the same attack is more likely to be caught early, and recovery shrinks to about five days.
Cost line (CA$) | Current state | With controls |
Lost revenue (CA$410,959/day × 60% × days) | 3,452,000 (14 days) | 1,233,000 (5 days) |
Idle labor and overtime (CA$40,000/day) | 560,000 | 200,000 |
Recovery spend (IR, forensics, counsel, rebuild, notification) | 1,200,000 | 700,000 |
Regulatory and legal exposure (expected, not maximum) | 300,000 | 150,000 |
Single loss expectancy | 5,512,000 | 2,283,000 |
Annual likelihood | 20% | 10% |
Annualized loss expectancy | 1,102,000 | 228,000 |
The controls cut expected annual loss by about CA$874,000 for an annual cost of CA$250,000. That’s a return on security investment of roughly 250%, or about CA$3.50 of avoided loss for every dollar spent.
That is a conversation a CFO recognizes. Instead of debating security spend in isolation, leadership can compare the investment with the financial exposure it is intended to reduce.
Where the Inputs Come From
- Revenue and labor figures: your finance team.
- Revenue dependency and recovery times: your business continuity plan, validated by actually testing restores.
- Recovery spend: your incident response provider’s rate card, your cyber insurance panel rates, and industry benchmarks.
- Regulatory exposure: legal counsel, based on the data you hold and where your customers and employees live.
- Likelihood: your industry’s incident data, your own near-miss history, and an honest assessment of your controls. A cyber risk assessment is one of the fastest ways to ground this number in evidence rather than guesswork.
Use Ranges, Not Single Numbers
Every input above is an estimate, and a board will rightly push back on false precision. Present each scenario as a low, likely, and high range. For the manufacturer above, that might be an ALE of CA$600,000 to CA$1.8 million today, with CA$1.1 million as the most likely figure. Ranges are more honest, more defensible, and in our experience they actually build more trust with directors than a single confident number.
How to Present Cyber Risk to the Board
The model is only half the work. The presentation has to turn analysis into a decision. A board-ready view should fit on one page and focus on financial exposure, risk appetite, investment choices, and residual risk:
- Lead with the top three scenarios in dollars. For most mid-market organizations, these are ransomware, business email compromise and payment fraud, and a third-party or supply-chain breach. Show each as a likely annual loss with a range.
- Show the gap against risk appetite. If the board has said it can tolerate an annual cyber loss of CA$500,000, and your likely ALE is CA $1.1 million, the gap is the story.
- Offer two or three investment options, each with its effect. Show what each one costs and how much expected loss it removes. Let the board choose between real trade-offs instead of approving or rejecting a single ask.
- Show what’s transferred and what isn’t. Cyber insurance moves some loss off the balance sheet, but not all of it. Retentions, sub-limits, and exclusions are real, and claims can be reduced if controls you attested to weren’t actually in place.
- Commit to a measurement cadence. Update the numbers quarterly or after any significant incident, tabletop exercise, or control change, so the board sees whether its investment is working.
Keep the technical details in an appendix. Directors want to know that someone has done the work, not to review the work themselves.
Common Mistakes to Avoid
Leading with worst-case numbers. Opening with a CA$25 million maximum penalty gets attention once. After that, it reads as fear-based selling and undermines the rest of your model. Lead with likely figures and show the tail as a range.
Counting only the ransom. The ransom is often a fraction of the total cost, and many organizations never pay one. We dug into the data on that in To Pay or Not to Pay.
Using recovery times nobody has tested. A business continuity plan that says “restore in 48 hours” is only an input if someone has proven it. Untested recovery times are the most common reason models underestimate downtime.
Assuming insurance makes the risk go away. Insurance is a financing tool, not a control. Model what you’d pay after retentions and sub-limits and remember that coverage depends on the controls you’ve represented.
Building the model once. Threats, your environment, and your controls all change. A model that’s a year old is describing a different company.
Keeping it inside security. The strongest cyber risk models are built with finance, legal, operations, and security at the table. That improves the inputs and creates shared ownership of the assumptions when the analysis reaches the board.
Frequently Asked Questions
How do you calculate the cost of a cyberattack?
Add up three buckets: downtime (lost revenue, idle labor, and contract penalties), recovery spend (incident response, forensics, legal, rebuilding, and notification), and regulatory and legal exposure. Multiply that single-incident cost by the annual likelihood to get annualized loss expectancy.
What is annualized loss expectancy (ALE) in cybersecurity?
Annualized loss expectancy is the expected yearly cost of a cyber risk. It equals the cost of a single incident multiplied by the probability that it happens in a given year. ALE lets leadership compare cyber risk directly against the annual cost of security controls.
How much does a data breach cost in Canada?
The average data breach in Canada costs CA$7.11 million, according to IBM’s 2026 Cost of a Data Breach Report, the highest figure since the study began. Energy, technology, and industrial organizations face the highest averages.
How do you present cyber risk to a board of directors?
Present your top three risk scenarios as dollar ranges, compare them to the board’s stated risk appetite, and offer two or three investment options with their cost and the expected loss each removes. Keep technical details in an appendix.
Do mid-market companies need software to quantify cyber risk?
No. A structured spreadsheet built with input from finance, legal, operations, and security can be enough to start. Dedicated platforms can help at scale, but the value comes from realistic scenarios, defensible assumptions, and repeatable measurement.
Does cyber insurance reduce cyber risk?
Cyber insurance transfers part of the financial loss, but it doesn’t reduce the likelihood or impact of an attack. Retentions, sub-limits, and exclusions still apply, and claims can be reduced if attested controls weren’t in place.
The Bottom Line
Boards do not need to master threat actors or detection logic to make good cyber-risk decisions. They need the same decision framework used for other material business risks: a realistic estimate of potential loss, a defensible view of likelihood, clear mitigation options, and visibility into residual exposure. When CISOs and IT leaders translate cyber risk into financial terms, the conversation shifts from technical activity to business resilience and investment discipline.
Turn cyber exposure into a board-ready decision.
Start with the Cyber Risk Readiness Scorecard to identify where your organization may have the greatest financial exposure and where deeper validation can create the most value.
Cyber Risk Readiness Scorecard
Need a deeper, evidence-based view? CyberClan’s Cyber Risk Assessments and Governance, Risk, and Compliance teams work with leadership to turn real control gaps into board-ready financial exposure. Cyber Risk Assessments Governance, Risk, and Compliance
Sources
- IBM Canada, 2026 Cost of a Data Breach Report press release (July 29, 2026): CA$7.11M average Canadian breach cost; supply-chain cost driver.
- ConnectCRE coverage of the IBM report: supply-chain compromise adds about CA$367,900 per incident.
- Sophos, State of Ransomware 2026: US$1.7M average recovery cost excluding ransom.
- Osler, Law 25 enforcement scheme: Law 25 administrative and penal penalty ceilings.
- Mondaq, Quebec’s Bill 64 overview: PIPEDA fines of up to CA$100,000.